


Brits cut down on time spent on social media last year

Daily time spent by Brits on social media fell 11% in 2024 to one hour and 37 minutes, according to the latest report from We Are Social and Meltwater.
Nevertheless, Digital 2025: United Kingdom found that UK ad investment in social media grew 13.8% year on year to £9.02bn. Influencer ad investment grew at a comparable 13.6% to £930m.
Advertisers may be responding to general increases in ad reach across the majority of social platforms, despite consumers’ total time spent on such platforms decreasing. For example, Pinterest’s ad reach grew 14.7% to 15.5m and TikTok’s rose 9.2% to 24.8m. Meanwhile, Meta platforms’ ad reach stayed fairly stable (+3.2% to 38.3m on Facebook and +0.9% to 33.4m on Instagram).
In comparison, Elon Musk-owned X saw its ad reach decline 10.7% to 22.9m, as users left the platform amid changes to its content moderation strategy and continued controversial behaviour by Musk, who is now working as an unofficial aide to US president Donald Trump.
“Our time is more precious than ever and people are increasingly discerning about how and where they spend it,” commented We Are Social UK CEO Jim Coleman.
He continued: “While it’s encouraging to see healthy growth in digital, social and influencer adspend, the underlying message from this data is that marketers can’t afford to cut corners.
“People who consumer any type of media — from TV to online — are looking for quality over quantity. On social, this means that brands need to add value — if they can’t, they will lose ground to others who can.”
TikTok dominates time spent, but Meta platforms a bigger reach play
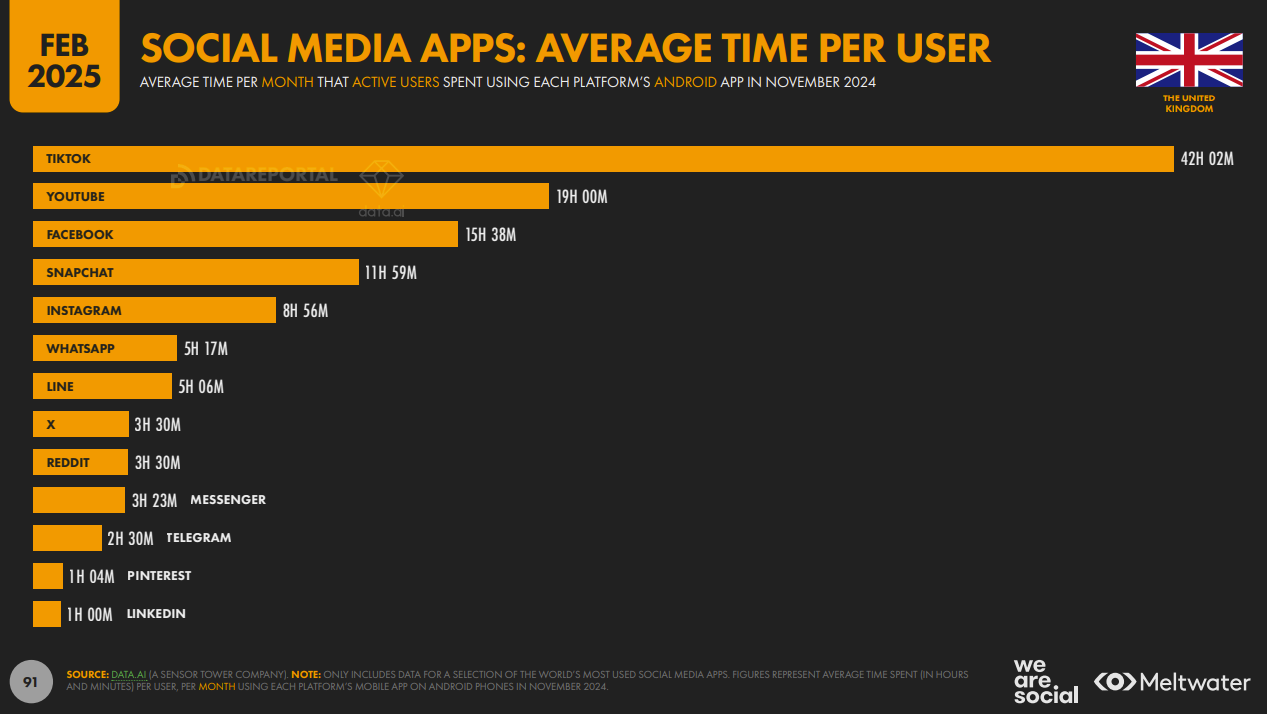
According to the study, Brits still spend substantially more time on TikTok (42 hours and two minutes per month on Android devices) than any other social app. The next most time spent was on YouTube, at less than half that total (19 hours).
However, compared with the year before, when TikTok users were found to spend more than 49 hours per month on the short-form platform, users are now spending 15% less time there.
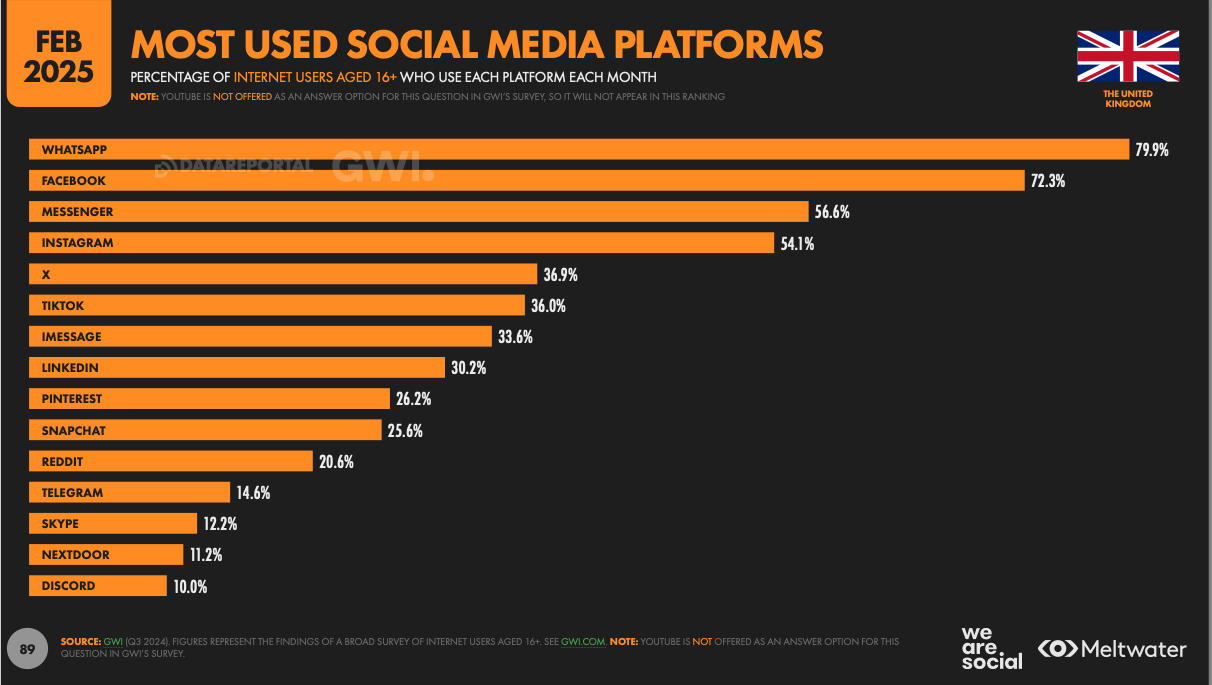
When measuring by platforms with the highest percentage of monthly active users relative to the UK’s total adult population, Meta platforms dominate.
WhatsApp (79.9%), Facebook (72.3%), Messenger (54.6%) and Instagram (54.1%) are the only social platforms that a majority of UK internet users actively use each month.
In comparison, only about one-third of Brits use X and TikTok, one-quarter use Pinterest and Snapchat, and one-fifth use Reddit.
However, breaking down app usage by the number of sessions reveals that, although overall time spent on Snapchat (11 hours and 59 minutes in a month on average) is modest compared with TikTok, users are by far checking in on the app more often than its competitors. This is likely due to its primary use as a messaging app.
Among the report’s other findings, We Are Social and Meltwater discovered that WhatsApp is not only the most used app by active monthly users, but also a plurality of survey respondents’ “favourite” social platform (29.1%).
Meanwhile, although nearly half (48.6%) of adult internet users said they use social media to find out about brands and products, only 16.1% of social media users follow brands and 17% said they follow influencers.
Subscriptions, search and shoppability: Social challengers go beyond the long tail