


‘The SME tail is wagging the dog’: Thinkbox urges reconsideration of ad market

At a Thinkbox event in London on Tuesday, the TV marketing body’s head of research argued that measuring adspend from the long tail of advertisers has skewed analysts’ ability to accurately measure growth in the ad industry and value traditional media channels.
“The AA/Warc data is presenting a picture of a vibrant, growing advertising industry,” said Anthony Jones. “Do we feel like that?”
The latest Expenditure Report found that total adspend in the UK rose 9.7% in Q3 2024 to £10.6bn, driven primarily by double-digit growth in search and online display. Total ad revenue for TV, meanwhile, fell 2.6% year on year.
But Jones argued that the strong market-level growth figures were being substantially skewed by small and medium-sized enterprises (SMEs) spending on search and social media placements that are “not real advertising investment as we would historically view it”.
Jones noted that before the Covid-19 pandemic, “one of the immutable laws of advertising investment” was that it was highly correlated with GDP growth (typically 1.0-1.5% of GDP). This changed beginning in 2020, when ad industry growth began running as a much higher share of GDP, driven almost entirely by “the pointy end of the funnel” — search, social and other pure-play digital spend — which has more than doubled ad revenue in the past five years.
“It’s almost like a cost to sale,” Jones said, citing the opinion of industry analyst Ian Whittaker. “For the online small brands, instead of buying rent, they’re buying search space to drive consumers to the store.”
Jones compared spend on digital pure-play channels — including retail media — to “digital shelf wobblers”, telling the audience at Ham Yard Hotel: “You might’ve spent money with a retailer in the past buying the gondola ends. You’re now investing in search and retail media. It is an essential spend, not a discretionary spend.”
How we define advertising comes with unintended consequences
Perception creating a feedback loop
Because adspend reports like that from the Advertising Association and Warc include the long tail, growth at digital platforms that have dominated that segment of advertisers — chiefly Google, Meta and Amazon — has appeared substantially larger than more traditional companies like the UK’s public-service broadcasters. That has led to City analysts undervaluing media owners focused on larger clientele, Jones argued.
“If you’re a media owner growing by 5% last year, that’s really pretty good,” he said. “But the City thinks you’re growing at half the rate of the industry. Therefore the City are potentially valuing your business as less successful than you might think it is.”
More importantly, Jones continued, the long tail has acted as a “powerful herding instinct”, distorting marketing leaders’ decision-making by causing them to question why they would not spend more money with the media channels growing at the highest rates — effectively creating a feedback loop where the fastest-growing companies become the most attractive for media investment.
Citing Profit Ability 2 data, Jones suggested that this was leading big brand advertisers to make poorer investment decisions by overspending on channels that “we have seen perform less effectively than other channels” — thus “resulting in lower returns and increased questions about the power of advertising”.
“The SME tail is wagging the dog,” he concluded.
While he conceded that the AA/Warc figures are vital to showing the overall industry’s “dynamism” to regulators and investors, he advocated that AA/Warc consider creating a “companion view” that only measures large and medium-sized advertisers (LMAs). He indicated that Warc was open to considering “producing this data in a different way”.
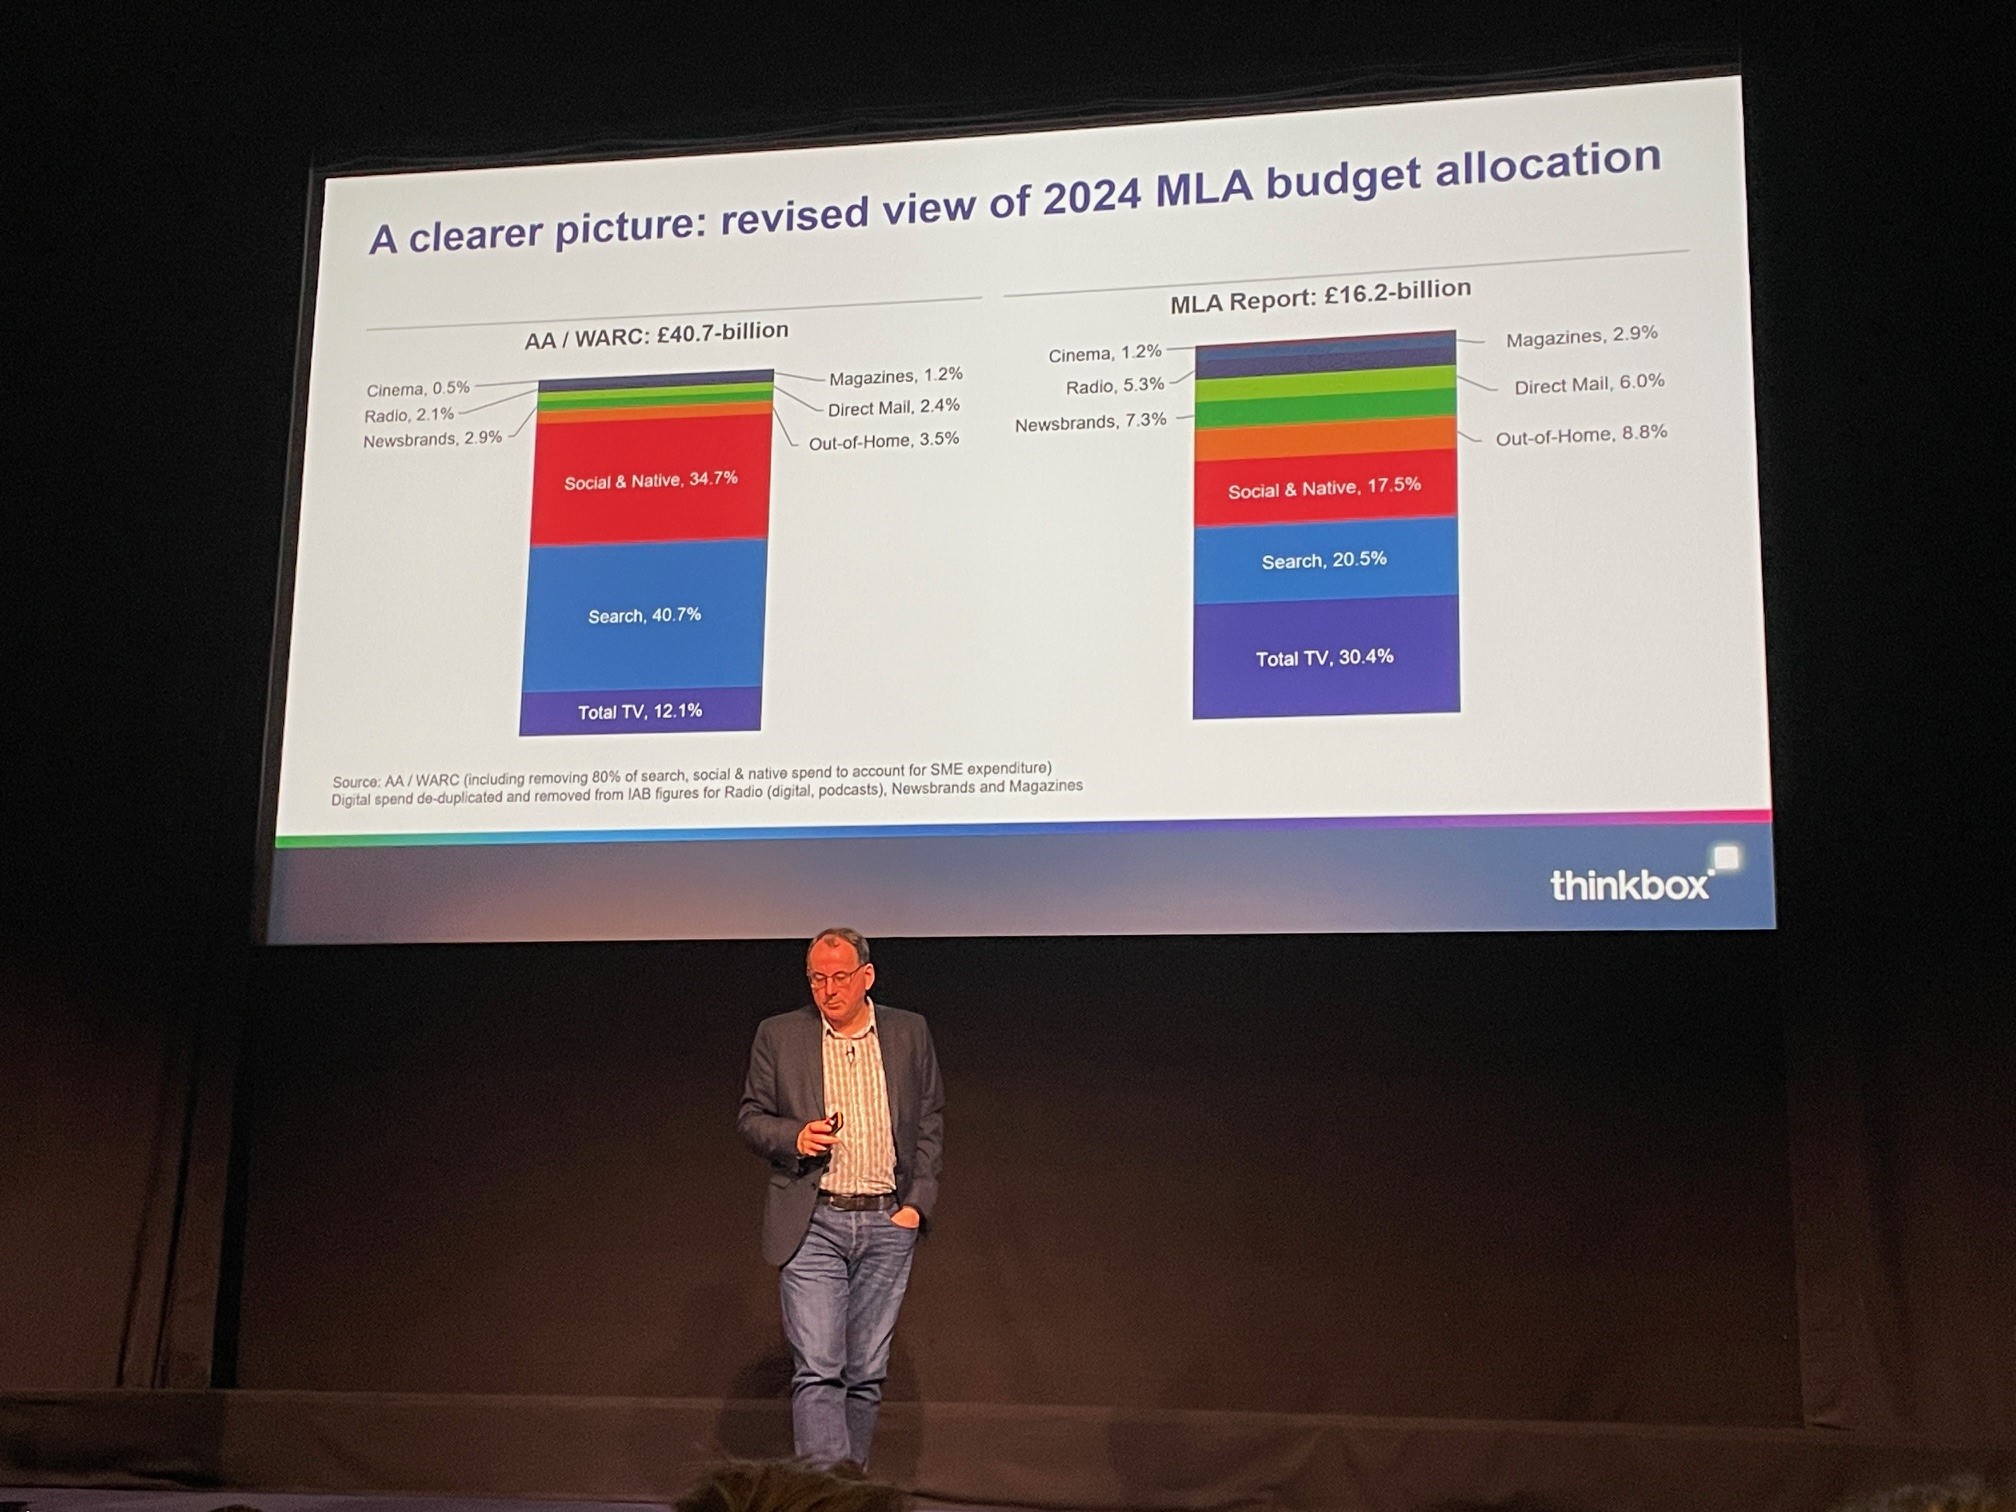
Removing SMEs from the AA/Warc report creates a vastly different picture of the ad market, according to estimates conducted by Jones. Whereas total TV receives only 12.1% of ad revenue with SMEs included in the data, the channel’s market share increases to 30.4% with them taken out.
A similar doubling or tripling effect is true of other more traditional channels like radio (from 2.1% to 5.3%) and news brands (2.9% to 7.3%). On the other hand, search halves (from 40.7% to 20.5%), as does social media and digital native (from 34.7% to 17.5%).
No dissonance with broadcasters’ FELT strategies
Thinkbox’s desire to develop a LMA-centric view of the ad market comes even as broadcasters themselves have in recent months moved to copy the tech platform playbook and chase after SMEs by making it easier to create, plan and spend on TV.
As ITV managing director Kelly Williams told a crowd at LEAD last month, the “big opportunity” for broadcasters is in the “fat end of the long tail” (FELT) — medium-sized brands built primarily on social media and paid search that are increasingly looking to scale via TV.
When asked by The Media Leader whether this development would impact Thinkbox’s desire to move away from focusing on SMEs as an indicator of growth, Jones added he does not believe it amounts to a “dissonance” with the broadcaster’s goals.
“There’s a bit of a Venn diagram here: small and medium, and medium and large,” he said. “What we need to do as an industry is to work out that bit in the middle — where is the cut-off for ‘medium’?”
Cutting TV from media plans leads to suboptimal results
Thinkbox’s Trends in TV 2025 event, which was jokingly described as an “orgy of unrelenting chartage” by CEO Lindsey Clay, featured Jones as well as new research presented by EssenceMediacom chief strategy officer Richard Kirk and partner George Gloyn.
Noting that Thinkbox leaders had expressed anecdotal evidence that brands were considering significantly reducing spend on TV (despite earlier research showing that TV is already under-invested) because the medium “can be quite difficult to buy”, Kirk and Gloyn set out to measure the effect a reduction in TV spend could have on brands’ profit.
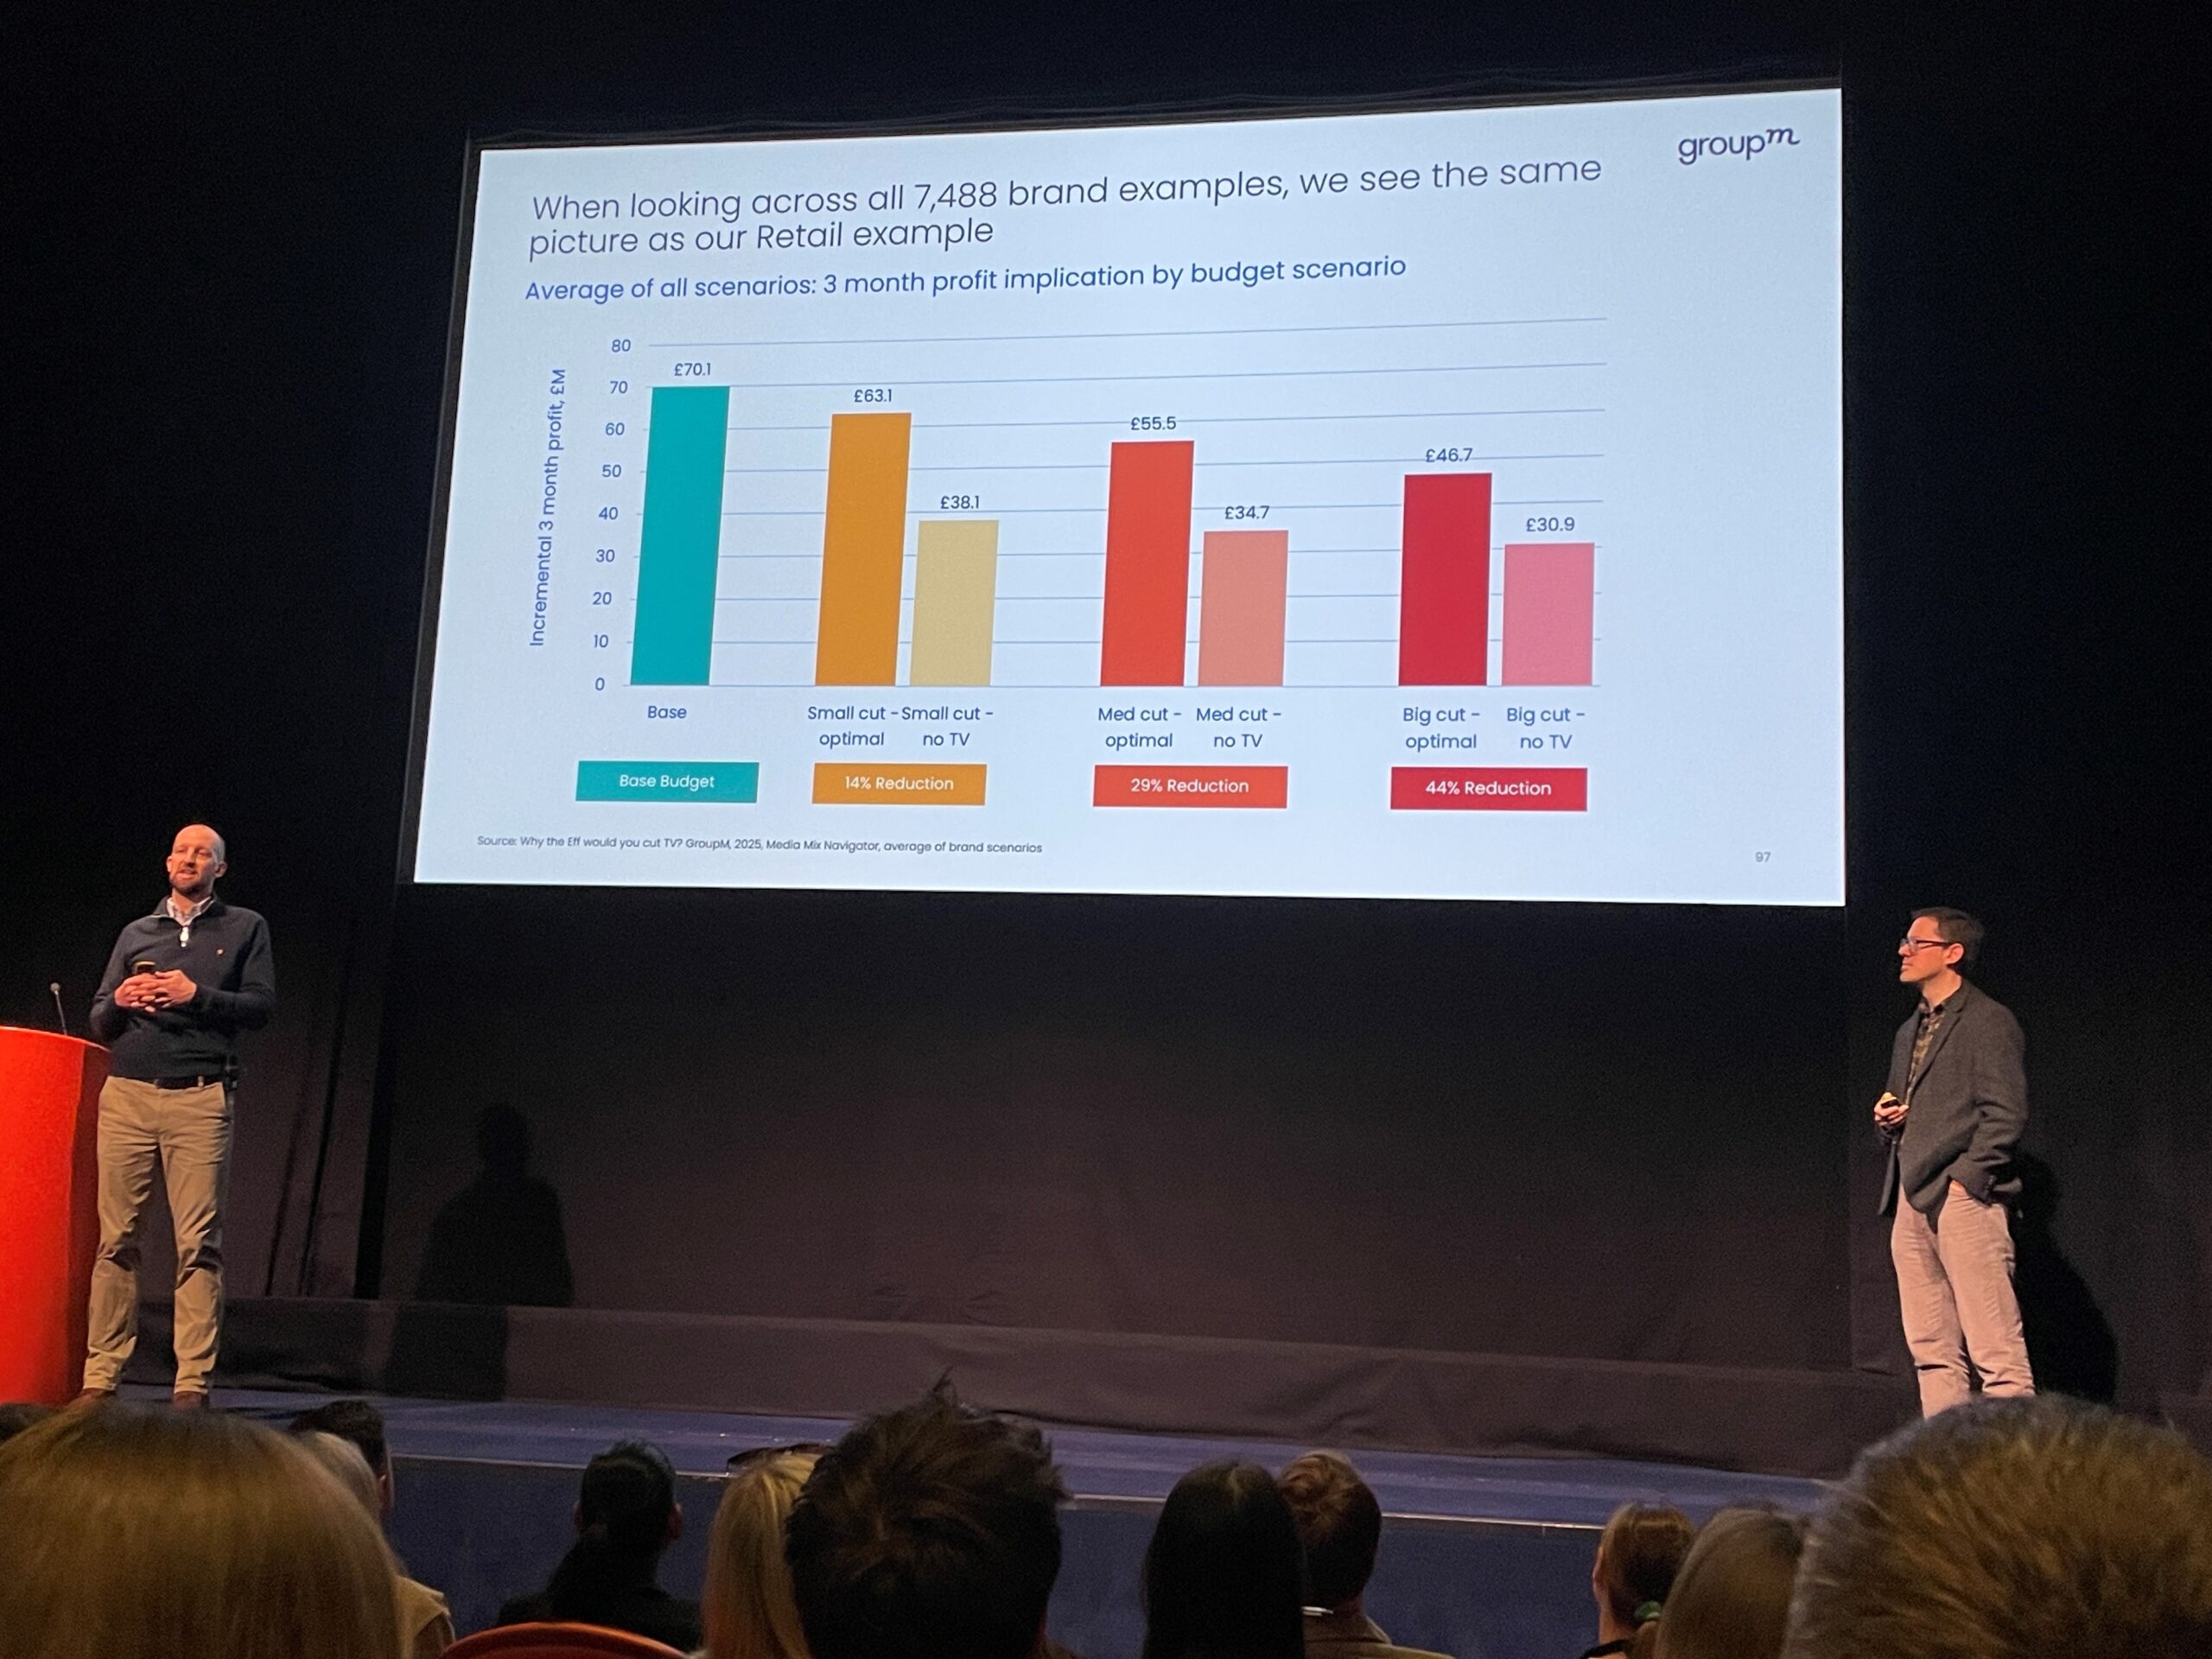
The study, dubbed Why the Eff would you cut TV?, used the Profit Ability 2 dataset and Thinkbox’s free Media Mix Navigator tool to understand how cutting TV from media budgets could lead to suboptimal profits. It found that, by removing linear TV completely from the channel mix, brands would on average see 24% less profit within three months compared with optimal budget reductions across a larger number of channels. Over a two-year period, this rises to 60% less profit — equivalent to £28bn of lost profit if every brand in the dataset decided to fully cut their TV budget.
According to Kirk, the findings suggest “money is being burnt on the table” when brands decide to remove TV from media plans.
In a separate study presented at the event, the pair revealed that they also uncovered TV’s “halo effect” on effectiveness in other media channels.
They concluded that, on average, when TV campaigns are live, lower-funnel response channels see a 13.7% improvement in performance compared with when TV campaigns are not live.